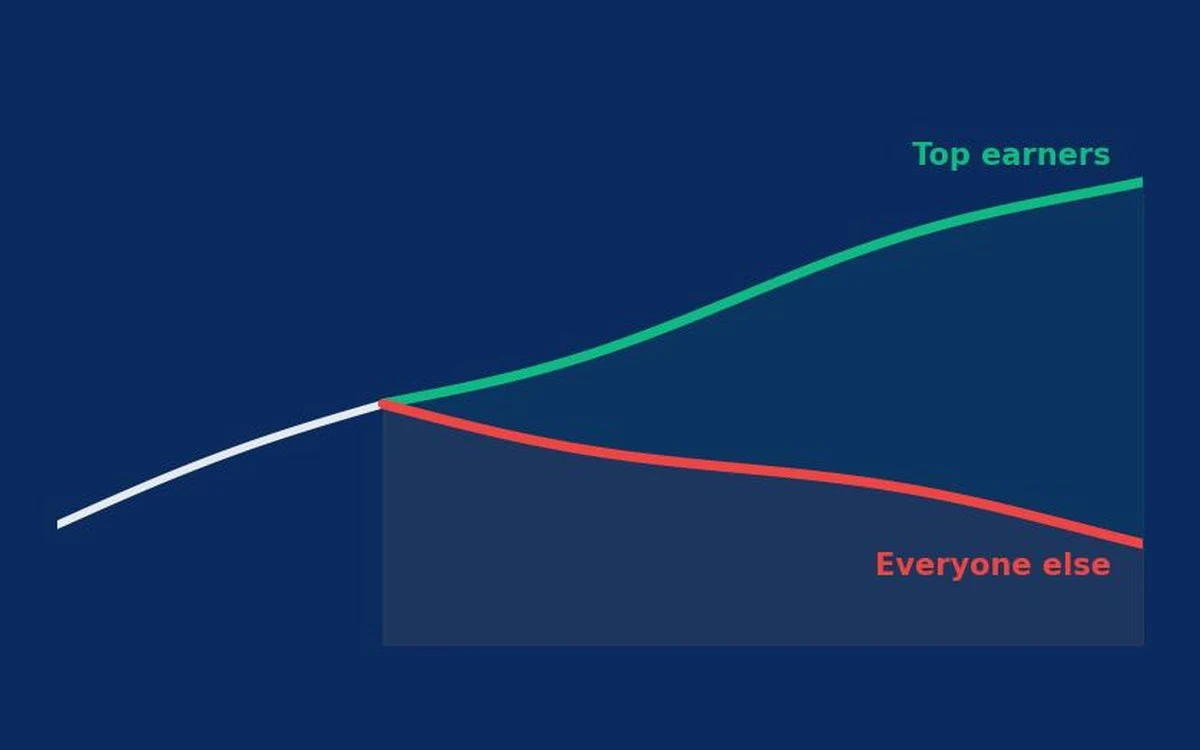
The top 10% of US earners now account for close to half of all consumer spending — a record high in data going back to 1989 — while spending by lower- and middle-income households has barely grown since 2023. Economists call this split the "K-shaped economy": one line rising, one line falling, both starting from the same point. It's no longer a fringe theory. It's showing up in retail earnings, credit data, the labor market, and the Federal Reserve's own household wealth statistics. Here's what's actually happening, why it's happening, and what it means for your own financial decisions in 2026.
What Is a K-Shaped Economy?
A K-shaped economy describes a recovery or expansion where different segments of the population experience opposite trajectories at the same time, instead of everyone rising or falling together. Picture the letter "K": a shared starting point, then one stroke angling upward and one angling downward.
- The upper arm: higher-income, higher-asset households — rising net worth, strong spending, high confidence
- The lower arm: lower- and middle-income households — flat or falling real spending, rising reliance on credit, low confidence
The term became popular after the 2020 pandemic recession, when asset owners recovered almost immediately while service-sector and hourly workers took years longer. In 2026, the shape hasn't gone away — in several ways, it has gotten sharper.
from the top 10% of earners
middle & lower earners since 2023
The 2026 Numbers Behind the Divide
Several independent sources now converge on the same story. Here's what the most recent data shows:
| Metric | Figure | Source |
|---|---|---|
| Top 10% share of US consumer spending | ~49.7%, highest since 1989 | Moody's Analytics, 2026 |
| Top 10% spending growth, Q3 2020–Q3 2025 | +62% | Moody's Analytics via Washington Post |
| Top 10% earner threshold | ~$250,000+ household income | Moody's Analytics / Census |
| US unemployment rate, July 2026 | 4.1% | Bureau of Labor Statistics |
| Nonfarm payrolls, July 2026 | -23,000 (jobs lost) | Bureau of Labor Statistics |
| Cumulative price increase since 2020 | ~25% | Federal data |
Figures reflect the most recently published data as of early August 2026. Spending-share estimates vary somewhat by methodology and source — see the note on data debate below.
Why the K-Shaped Divide Is Happening
1. The Wealth Effect at the Top
Stock markets and home values have both climbed to record or near-record levels through 2025 and into 2026. Because equity and real estate ownership is concentrated among higher-income households, those gains flow disproportionately upward. Rising portfolio and home values tend to make owners feel richer and spend more — a well-documented pattern economists call the wealth effect. The typical stockholder in the top 10% held roughly $1.1 million in equities recently, up sharply from a few years earlier.
2. Cumulative Inflation Hits Essentials Hardest
Prices remain roughly a quarter higher than pre-pandemic levels. That increase weighs far more heavily on lower-income budgets, where housing, groceries, and energy make up a much larger share of total spending. A household with little discretionary spending to cut has nowhere to absorb higher costs except by borrowing.
3. A Softening, Uneven Labor Market
The July 2026 jobs report showed nonfarm payrolls falling by 23,000, with the unemployment rate at 4.1% as labor force participation continued to decline and wage growth slowed. Job losses and hiring freezes tend to concentrate in lower-wage and hourly roles first, widening the gap in income stability between the top and everyone else.
4. Locked-In Low Mortgage Rates for Existing Owners
Many higher-income homeowners refinanced or bought during the era of sub-4% mortgage rates and are now sitting on both low fixed housing costs and a home that has appreciated significantly. Renters and newer buyers face today's higher rate environment with none of that cushion — a structural gap layered directly on top of the income divide.
How the K-Shape Shows Up in Everyday Life
| Category | Upper-Income Households | Lower/Middle-Income Households |
|---|---|---|
| Travel & luxury goods | Strong, often double-digit growth | Pulled back or flat |
| Discount retail & value brands | Limited relevance | Rising share of wallet |
| Credit card & BNPL usage | Used for convenience/rewards | Rising use to cover essentials |
| Consumer sentiment | Near multi-year highs | Near multi-year lows |
| Homeownership & equity gains | Rising net worth | Priced out or rate-locked out |
Is the Data Actually This Extreme? The Other Side of the Debate
Not every economist accepts the "top 10% drive half of spending" headline at face value. Some researchers, including analysts at the Federal Reserve Bank of Minneapolis, note that other data sources — like Bank of America card-spending data and the government's Consumer Expenditure survey — show a real but noticeably less extreme divide than the most-cited Moody's estimate. There's also academic pushback questioning the underlying methodology of that specific 49%-plus figure.
What's not seriously disputed: high earners are pulling further ahead in spending growth, and lower- and middle-income households have seen little real gain since 2023. The size of the gap is debated; the direction of the gap is not.
Build Your Own Financial Cushion
Whichever side of the K you're on, a solid emergency fund is your best protection against economic uncertainty. See how much you need.
Use Free Emergency Fund Calculator →What This Means for Your Own Finances
You can't personally undo a national spending trend, but you can make choices that reduce your exposure to it:
- Prioritize an emergency fund. A 3–6 month cash buffer matters more in a labor market that's cooling unevenly across income levels and industries
- Be cautious with buy-now-pay-later and revolving credit. Rising BNPL and credit card use for essentials is one of the clearest lower-arm warning signs in the data — it's a sign of strain, not a strategy
- Keep investing if you can, even modestly. Much of the upper arm's gains come from asset ownership, not just income — consistent contributions to retirement accounts help you participate in that side of the trend
- Watch essentials inflation specifically, not just the headline CPI number — housing, food, and energy costs matter most to your actual budget
- Reassess big fixed costs like housing and transportation, since these matter more to your financial resilience than discretionary cuts
Frequently Asked Questions
Key Takeaways
- The top 10% of US earners drive close to half of all consumer spending as of 2026 — a record high in data going back to 1989
- Spending among middle-income households (40th–60th percentile) has barely grown since 2023
- The divide is driven by the wealth effect from stocks and home values, cumulative inflation hitting essentials hardest for lower earners, and an uneven, cooling labor market
- The exact size of the gap is debated among economists, but the direction — high earners pulling further ahead — is not seriously disputed
- Individually, the best protection is an emergency fund, limited reliance on credit for essentials, and continued investing where possible
Data referenced: Moody's Analytics consumer spending analysis (2026); U.S. Bureau of Labor Statistics, Employment Situation, July 2026 (released August 7, 2026); Federal Reserve Distributional Financial Accounts, Q4 2025; Federal Reserve Bank of Minneapolis review of K-shaped consumer data (2026); Bank of America Institute consumer spending reports.
This article is for informational and educational purposes only and does not constitute financial, investment, or economic advice. Economic data is revised frequently and figures cited reflect the most recently available releases as of publication. Consult a licensed financial advisor for guidance specific to your situation.